
Tutorial
Thank you for looking into northstar! This tutorial guides you through a typical use of the package to annotate your single cell dataset based on one or more cell atlases. At the end of the tutorial, you can look at some Examples and at the detailed API documentation.
Flowchart
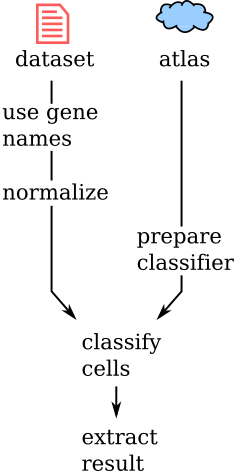
Short version
import anndata
import northstar

# Load new dataset
dataset = anndata.read_loom('GBM_data.loom', sparse=False)

# Set gene names (if needed)
dataset.var_names = dataset.var['GeneName']

# Normalize (if needed)
dataset.X = 1e6 * (dataset.X.T / dataset.X.sum(axis=1)).T

# Choose atlas
atlas = 'Darmanis_2015_nofetal'

# Prepare classifier
model = northstar.Subsample(
    atlas=atlas,
    )

# Run classifier
model.fit()

# Extract result
cell_types = model.membership
Intro: atlas landmarks
To transfer cell types from an atlas, you need an average or small subsample of cells for each cell type within the atlas. We call these atlas landmarks. To keep things simple, in this tutorial we use precomputed landmarks, in particlar the brain atlas from Darmanis_2015. Custom atlases are supported (see below).
Prepare your single cell dataset
Then we need to prepare the new dataset to annotate. For this tutorial, we will use the glioblastoma data from Darmanis et al. (2017) which is made available for this tutorial as a loom file at this address: download that file into the current folder with the name GBM_data.loom.
After the download is done, read it with anndata:
dataset = anndata.read_loom('GBM_data.loom', sparse=False)
Let’s make sure gene names are used as columns of the AnnData table:
dataset.var_names = dataset.var['GeneName']
Note
northstar will take the intersection of your features names and the atlas features to assign cell types. Most atlases use gene names instead of EnsemblIDs or other names, so make sure you do the same. Remember human genes all ALL CAPS but mouse genes are Capitalized only.
We need to normalize the dataset:
- log: northstar will take the logarithm of the counts when necessary. If your data is already logged, undo the transformation (by exponentiating and subtracting any pseudocounts) before using northstar.
- normalization: northstar will look for overdispersed features in the new dataset prior to normalization. It is therefore highly recommended to normalize your new data (e.g. by counts per million reads or counts per 10,000 reads).
dataset.X = 1e6 * (dataset.X.T / dataset.X.sum(axis=1)).T
Note
Forgetting to format the data according to the two rules above can lead to gross misclassification.
Choose an annotated atlas
You can choose one of the available atlas landmarks by name, e.g. Darmanis_2015 is an early atlas of the human brain, and Darmanis_2015_nofetal excludes fetal cells (our tutorial glioblastoma data are all adult tumors).
Optional: exploring atlas landmarks
northstar provides a class to explore our precompiled landmarks:
import northstar
af = northstar.AtlasFetcher()
To list available atlases, just type:
af.list_atlases()
and to download one of them, for instance:
myatlas = af.fetch_atlas('Darmanis_2015_nofetal', kind='subsample')
Note
If you just use the name (string) of a precompiled atlas landmark in the classifier (see below), the landmark will be automatically downloaded for you.
Alternative: custom atlas
You can also use a custom atlas. In that case, the atlas should be in an AnnData object (with rows as cells, genes as columns):
- If you plan to use the Subsample class, the AnnData must have an obs column called
CellType that describes for each cell its cell type. - If you plan to use the Averages class, the AnnData must have an obs column called NumberOfCells that is used to weight each cell type in the PCA. A value of 20 for all cell types is typical.
northstar provides a function to subsample an existing annotated dataset to small cell numbers within each cell type, ready for further use with the Subsample class. You data must be in an AnnData object. You can call it by:
import northstar
myatlas = northstar.subsample_atlas(mydataset)
The default metadata column used for subsampling each cell type evenly is CellType. If your dataset uses a different column, you can just set the cell_type_column argument in this function.
Remember that the metadata column CellType is required anyway to use northstar. So you should set your cell type information into that column before or after subsampling:
myatlas.obs['CellType'] = myatlas.obs[my_other_column]
Prepare the classifier
Let’s use the Subsample class:
import northstar

model = northstar.Subsample(
    atlas='Darmanis_2015_nofetal',
    )
Classify your cells
This is where the actual computations happen:
model.fit()
Advanced: understanding the single steps
If you are curious about the steps within northstar, you can call in your Jupyter notebook or ipython console:
model.fit??
and check out the steps one by one. Most users will not need this.
Extract the result
The result of the cell type assignment can be extracted by the following command:
cell_types = model.membership
This is a numpy array with the same length and order as your cells.
Note
You can also run the classifier and exctract the result all at once using model.fit_transform().
Downstream analysis
northstar’s main job is done with the cell type classification. Here some common downstream steps.
Optional: embbedding
Embeddings in two dimensions are useful to characterize single cell data. Northstar merges the atlas subsample/averages and the new dataset into the same PC space, and it’s easy to get an embedding of your data “into” the atlas:
embedding = model.embed(method='umap')
Available embeddings are tsne, umap, and pca.
Optional: closest atlas cell type
Sometimes you get novel clusters that do not match any atlas cell type. To start identifying those clusters, you can ask northstar what known atlas cell type they are most similar to. Here’s the code to do that:
closest_cell_types = model.estimate_closest_atlas_cell_type()
The output is a pandas.Series with the novel clusters as index and the closest atlas cell types as values.
Optional: custom data harmonization
northstar divides the cell classification task in two steps:
- Create a similarity graph that contains both the atlas and the new data
- Cluster that graph with awareness of the atlas annotations.
For advanced users, it is possible to use a custom approach to step 1 and only use northstar for the atlas-aware clustering step 2. In this scenario, the similarity graph might be constructed using external data harmonization algorithms, such as scVI, BBKNN, Seurat3, or whatever else.
northstar offers the class ClusterWithAnnotations for this purpose:
import northstar
model = northstar.ClusterWithAnnotations(graph, cell_types_atlas)
cell_types_newcells = model.fit_transform()
where graph must be a igraph.Graph instance from python-igraph or a dense or sparse boolean square matrix representing the adjacency matrix of the graph (i.e. it has nonzeros on on graph[i , j] if cell i and cell j are neighbors).
Conclusion
We hope northstar helps you understand your tissue sample and do not hesitate to open an issue on github if you have trouble. If northstar was useful for a publication, please consider citing us on bioRxiv.
